(Georgia) Region G Local Information Network for Emergencies
This site is devoted to Public Health related issues affecting Augusta, Georgia and the Central Savannah River Area (CSRA), with a focus on Influenza (Flu). We also feature updates on other health related events of regional interest. Region G is a Georgia Health Department-recognized region, centered around Augusta, Georgia - composed of health-related organizations including 14 hospitals.
Augusta Area Flu Updates
March 1 2020. Augusta’s flu season started in November, quite early for the average flu season, and has now seen two peaks in activity. We saw a peak in influenza B in late December, then a rapid replacement of flu B by influenza A, a related but distinctly different virus, starting around the New Year. Flu A appears to have peaked in the CSRA around the beginning of February, and has been dropping sharply every since then. Augusta area hospitals are reporting positive flu test results in about 10% of both children and adults who are tested, meaning 90% do NOT have flu; they have another respiratory virus. There is no COVID-19 (Coronavirus) in the CSRA (yet). We are well on our way out of the flu season for 2019-2020. It should be largely gone from the CSRA in the next 2-3 weeks.

Week 9, 2020
CDC graph of visits nationally for Influenza-like illness (ILI), 2019-2020 in red triangles. The rest of the curves above represent data from prior years.
There is a one-week lag between data collection and data availability through the CDC. Flu is on its way out throughout the US. We have had three straight weeks of dropping rates of influenza-like illness (fever PLUS either cough or sore throat). ILI is an excellent predictor of flu activity when influenza is known to be circulating. The flu season is not over, but the end is near. To date, there have been 136 pediatric deaths nationally from flu. CDC estimates there have been 34 million infections and 20,000 deaths in all age groups, a fairly typical season.
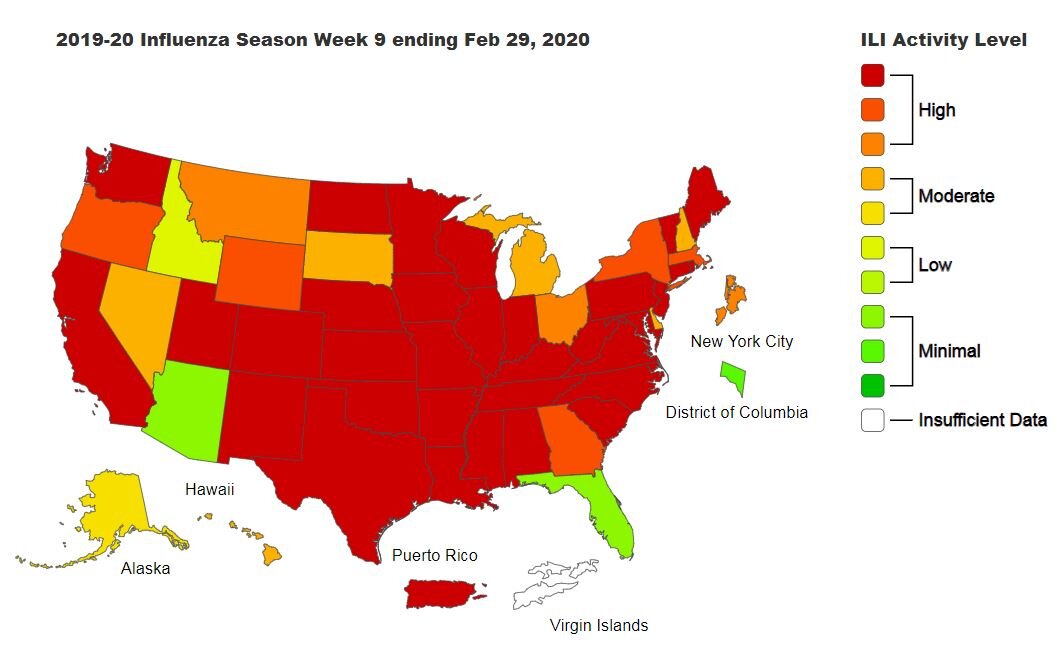
Week 9, 2020
Flu intensity is dropping throughout the US. CDC this week reported that the number of states with high levels of activity has dropped from 45 to 42. Georgia is reporting less intense activity, and Florida is reporting minimal activity. Georgia and the Southeast led the way with early flu activity starting in November. We are finally coming out of this difficult season. Look for activity in Georgia to drop to the minimal range in the next 2-3 weeks.
Georgia ILI Week 5, Feb 22 2020
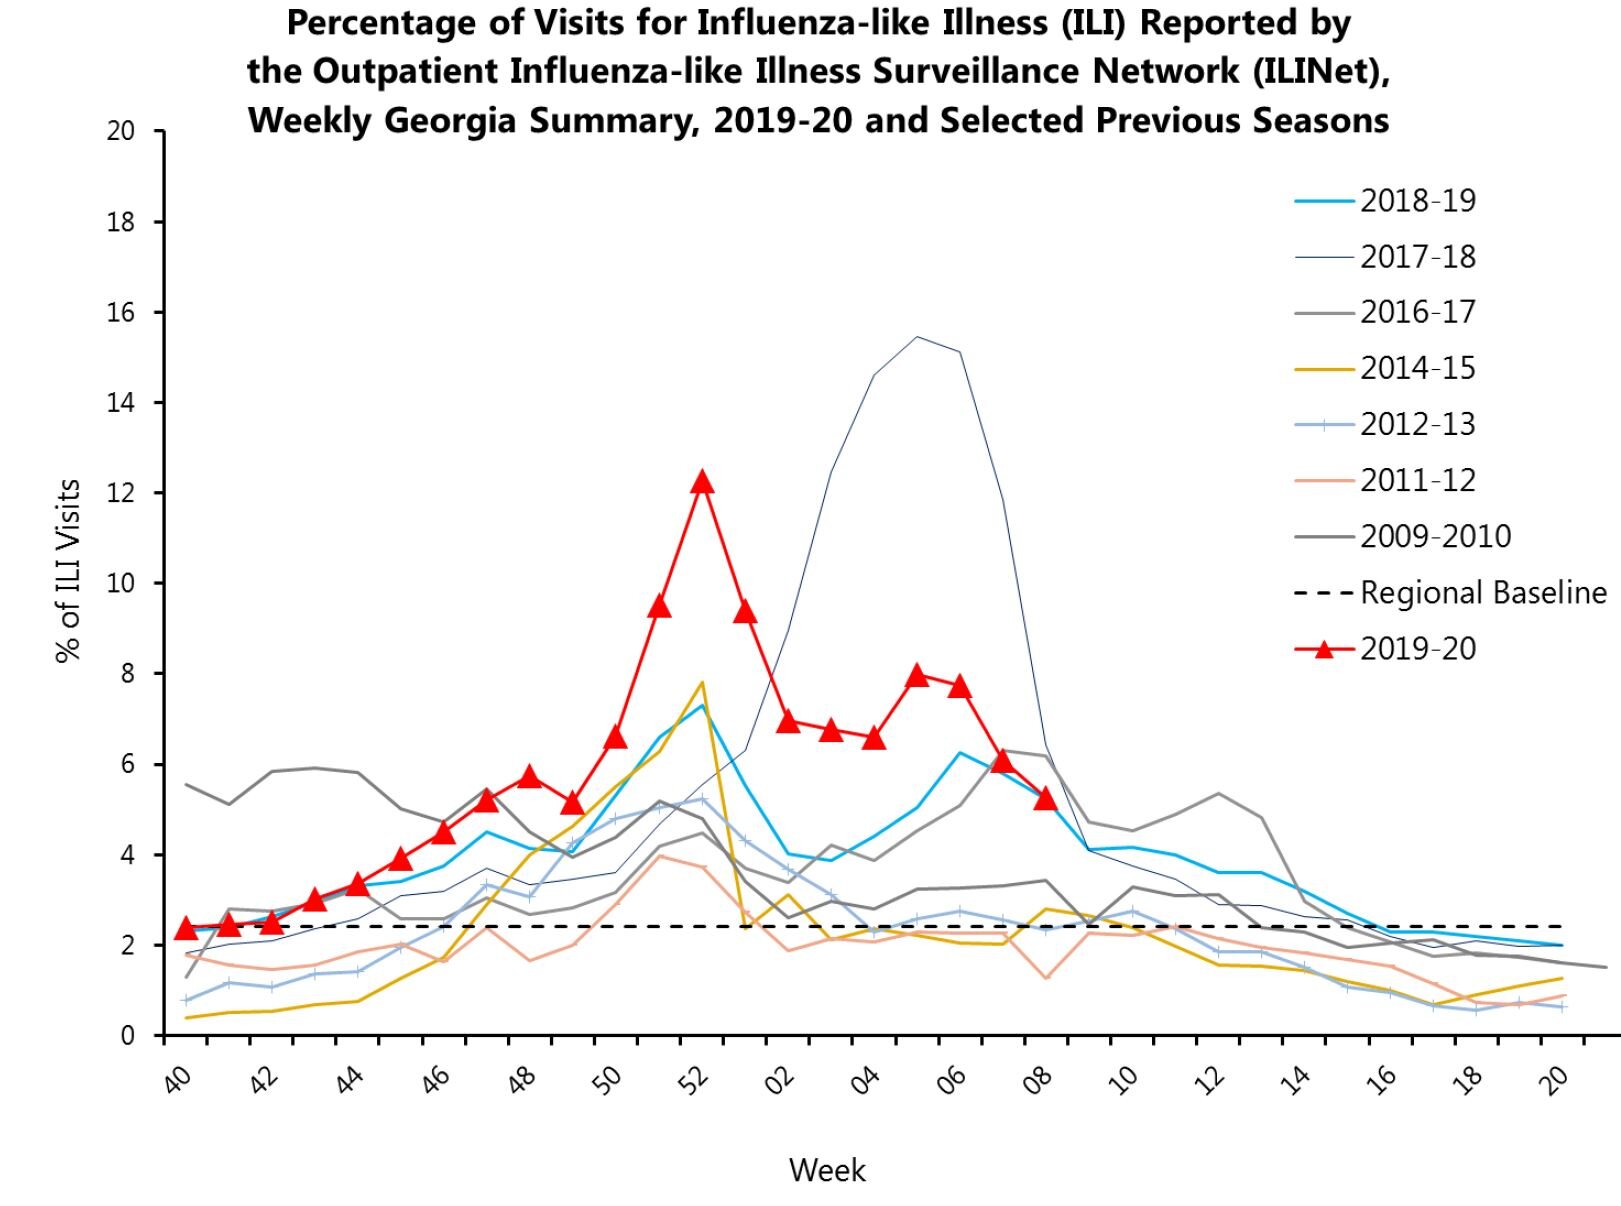
Week 8 2020 Georgia Curve
February 22, 2020: Flu-like illness peaked in Georgia in late December, then peaked a second time in mid-February. Just like the rest of the country, Georgia is experiencing a second peak of flu activity, this time due to influenza A. We have now had 2-3 weeks of decreasing flu activity in Georgia. Flu season is winding down; flu should be largely gone from Georgia by mid- to late March.
COVID-19: General information for the Medical Community and the public about the novel Coronavirus from China
(Also known as SARS CoV-2, or n-CoV 2019)

Augusta Area Bulletin Board: Other Health Related Topics in the News Locally
FAQ
Region G Hospitals
Click on any Region G hospital to go to their home page.